

August 3, 2026
Echo45 Advisors Investment Committee
Markets experienced a challenging environment in July with major indices ending the month slightly lower. However, this is in the context of healthy year-to-date gains and a broad market that is not far from its all-time high. A number of factors drove day-to-day market moves, including new concerns around AI investments, Treasury yields climbing toward multi-year highs, oil prices rising following a breakdown in the Middle East ceasefire, and the Federal Reserve keeping rates unchanged.
Many of these events reflect longer-term themes that could continue to drive volatility in the coming months. At the same time, these trends have also propelled markets this year, highlighting the importance of portfolio balance and maintaining a longer-term perspective. What lessons can investors learn from the past month as they navigate the rest of the year?
Key Market and Economic Drivers in July
• The S&P 500 and Nasdaq declined -0.1% and -3.2%, respectively, while the Dow Jones Industrial Average rose 0.3% in July.
• Volatility jumped in the middle of the month with the VIX index climbing as high as 21 before settling back toward 16.
• International developed markets returned 1.9% based on the MSCI EAFE Index in U.S. dollar terms, while emerging markets fell -3.3% based on the MSCI EM Index.
• The 30-year Treasury yield surged to a 19-year high to close around 5.28% and the 10-year Treasury yield ended the month at a peak of 4.74%. The Bloomberg U.S. Aggregate Index fell -1.3%.
• Oil prices rose with Brent crude climbing above $100 before closing at $90 per barrel and WTI at $85 per barrel.
• The U.S. Dollar Index (DXY) fell just under 100 while the Japanese Yen depreciated significantly, closing around 157. Gold ended the month approximately unchanged at about $4,050 per ounce.
• Second quarter real GDP growth increased at an annual rate of 1.5%, down from the 2.1% growth recorded in the first quarter of the year.
• At the July FOMC meeting, the Federal Reserve decided to keep rates unchanged at 3.50%-3.75% in a 9-3 vote.
AI investment fuels mixed results across the tech sector
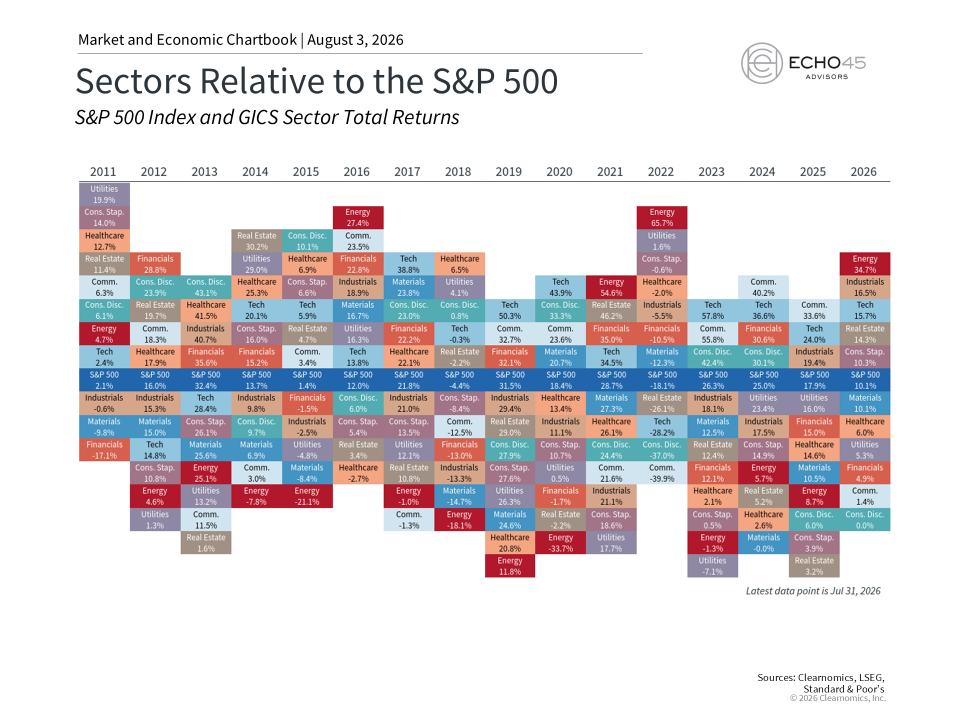
Corporate earnings reports for the second quarter raised new questions around AI investments. This caused market swings, primarily reflecting investor concerns over the free cash flow of large technology companies, often referred to as “hyperscalers.” These companies continue to invest hundreds of billions in new data centers and AI infrastructure, which the market is scrutinizing to determine whether these massive capital expenditures will translate into profits. At the same time, spending on data centers alone has become a meaningful contributor to U.S. economic activity, surpassing all other categories of office construction.[1]
Concerns over this level of investment are also triggering volatility in international markets, specifically among global semiconductor companies. Major chip suppliers faced sharp corrections during the month, leading the South Korean KOSPI 200 index to fall 24% in July, with continued volatility after a significant run up in 2025. Thus, while AI continues to be a major theme fueling markets, there are also periods of volatility to navigate.
Another AI development in July was the release of a new large language model, Kimi K3, by the Chinese company Moonshot AI.[2] This model reportedly competes with the most advanced models from companies such as OpenAI, Anthropic, and Alphabet. It is also “open weight,” meaning that anyone with the right hardware can run the model themselves, in contrast to most frontier models which are proprietary.
So, while last year’s DeepSeek models showed that AI models could be more efficient, Kimi K3 shows that newer open models can be competitive with cutting-edge ones. This creates further uncertainty about the future of the AI industry, both in terms of hardware and infrastructure needs, as well as which country will lead the next phase of AI capabilities.
Additionally, Fitch, the credit rating agency, flagged what it described as "major credit risk" across the AI ecosystem. Their report cited slowing consumer momentum and the highly interconnected nature of financing and supply arrangements among major players.[3]
For long-term investors, it’s important to remember that the AI theme is only one set of factors driving markets. In fact, the chart above shows that other sectors have performed well this year, including Energy, Industrials, and more. While markets will continue to gauge the long-term economic impact of AI, investors should continue to stay balanced across sectors and asset classes.
Middle East conflict briefly pushes oil back above $100
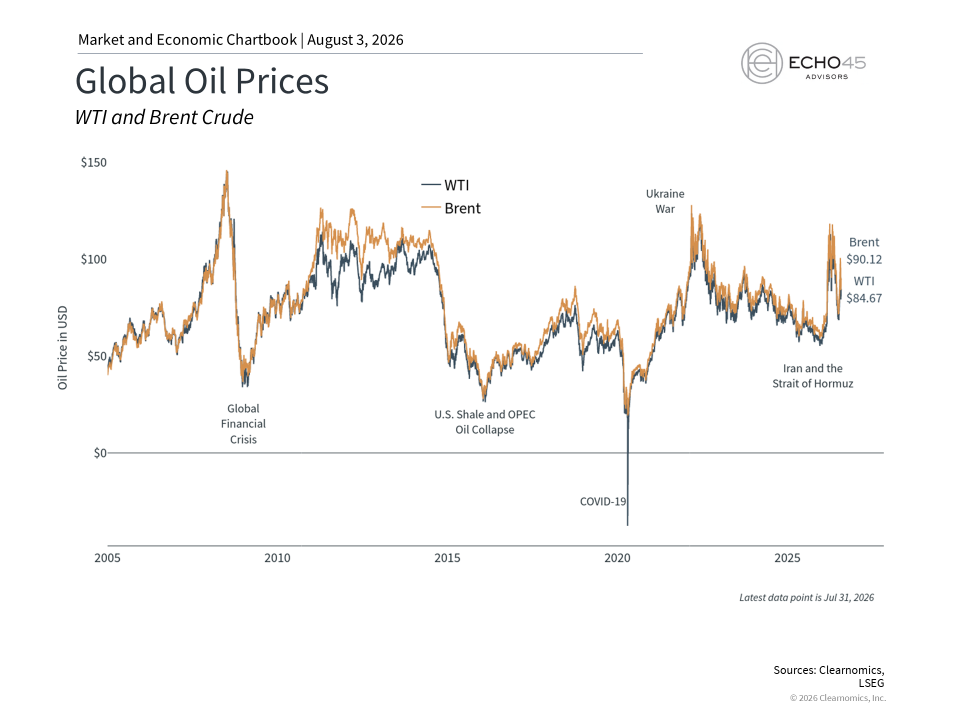
The ongoing conflict in Iran also led to short-term market moves. Tensions reignited mid-month when the U.S. conducted more airstrikes against Iranian military sites, leading to slower traffic through the Strait of Hormuz, a critical chokepoint for global oil. The conflict also expanded when another waterway, the Bab al-Mandeb Strait in the Red Sea, also came under fire after Yemen's Houthi forces struck Saudi Arabian oil tankers.[4]
In response, Brent crude jumped above $100 briefly before settling back to roughly $90 by month-end. In comparison, oil had fallen to as low as $72 per barrel in early July. Higher energy prices matter for the broader economy because they directly raise fuel costs for households and businesses. Gasoline prices are still hovering around $4.10 per gallon across the country, which could potentially keep headline inflation higher.[5]
The Federal Reserve holds rates amid a divided committee
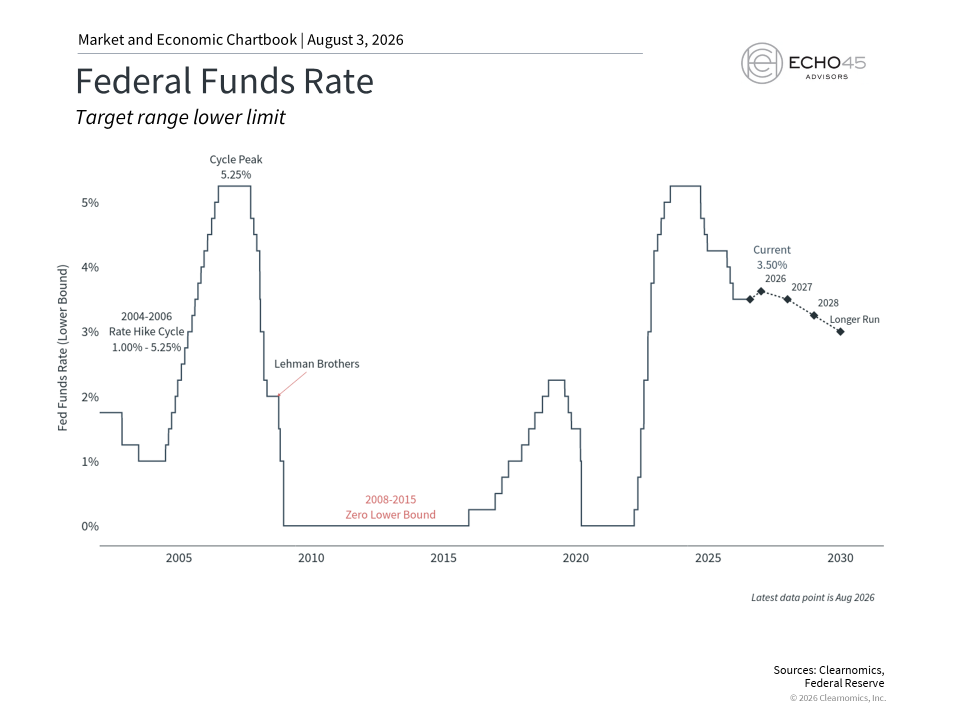
At its July meeting, the Federal Open Market Committee (FOMC) kept the federal funds rate unchanged within a range of 3.50% to 3.75%, despite concerns over higher inflation.6 This led to additional market volatility as bond yields rose and investors tried to gauge when the Fed might begin raising rates.
Specifically, new Fed Chair Kevin Warsh has intentionally reduced communication around how the Fed may act at future meetings. Not only is the FOMC statement much simpler, but he has avoided questions on how the Fed might react to different economic scenarios. Less “forward guidance” means that investors may be less sure about how the Fed might respond to higher inflation, a slower labor market, and other factors.
The immediate market reaction was a jump in bond yields, with both nominal and real Treasury rates climbing to their highest levels in recent years. Market-based expectations also suggest the Fed could raise rates once by October, and possibly twice by the middle of 2027.
Furthermore, three Fed officials dissented at its latest meeting, meaning they favored a rate increase. This represents a level of internal disagreement that has been rare in recent years - a disagreement of this kind last occurred in September 2016. For markets, this represents a hint as to what the Fed may be considering at upcoming meetings, especially if inflation remains elevated.
For investors, Fed uncertainty could result in greater volatility in yields. At the same time, higher yields represent opportunities for portfolio diversification.
New tariffs add more economic uncertainty
New tariffs added further complexity to the economic backdrop in July. After the Supreme Court ruled that last year’s reciprocal tariffs under the International Emergency Economic Powers Act were illegal, the administration responded by implementing new tariffs under a different trade law, Section 122 of the Trade Act of 1974. Those tariffs expired in July, resulting in the White House implementing additional new tariffs under different trade rules.
What this boils down to is that many countries now face tariffs ranging from 10% to 12.5%. Additionally, certain countries face much higher rates, including a 50% tariff on certain Canadian goods such as cement, dairy, and alcohol. These tariffs were rolled out under Section 338 of the Tariff Act of 1930, citing what the administration described as discriminatory treatment of American products.7
As always, the economic effects of these tariff measures will take time to materialize. The key consideration for long-term investors is that many of the market and economic concerns from tariffs have not played out as some had feared. While tariffs do affect specific industries and consumer prices, companies can also react and adjust their pricing over time. In fact, the economy has grown steadily and the S&P 500 has hit many new all-time highs over the past year.
The bottom line? July reinforced the importance of keeping a long-term perspective. Market challenges can create opportunities for investors who are positioned across different asset classes. Staying focused on the bigger picture, rather than reacting to the news headlines, remains the best way to achieve financial goals.
References
1. https://www.census.gov/construction/c30/c30index.html
2. https://forum.moonshot.ai/t/kimi-k3-is-here-our-most-capable-model/480
3. https://www.fitchratings.com/research/banks/ai-market-correction-emerging-as-major-credit-risk-27-07-2026
4. https://apnews.com/article/yemen-saudi-houthis-attack-shipping-red-sea-4e25fbdad821762e478173e6308884fb
5. https://gasprices.aaa.com/
6. https://www.federalreserve.gov/newsevents/pressreleases/monetary20260729a.htm
7. https://www.whitehouse.gov/fact-sheets/2026/07/fact-sheet-president-donald-j-trump-imposes-additional-tariffs-on-canada/
Index Descriptions
S&P 500
The Standard & Poor’s 500 Index is a capitalization-weighted index of 500 stocks designed to measure performance of the broad domestic economy through changes in the aggregate market value of 500 stocks representing all major industries.
Dow Jones
The Dow Jones Industrial Average consists of 30 stocks that are major factors in their industries and widely held by individuals and institutional investors.
NASDAQ
The NASDAQ Composite Index measures all NASDAQ domestic and non-U.S. based common stocks listed on The NASDAQ Stock Market. The market value, the last sale price multiplied by total shares outstanding, is calculated throughout the trading day, and is related to the total value of the Index.
MSCI Emerging Markets Index
The MSCI EM (Emerging Markets) Index is a free float-adjusted market capitalization weighted index that is designed to measure the equity market performance of the emerging market countries of the Americas, Europe, the Middle East, Africa and Asia. The MSCI EM Index consists of the following emerging market country indices: Brazil, Chile, Colombia, Mexico, Peru, Czech Republic, Egypt, Greece, Hungary, Poland, Qatar, Russia, South Africa, Turkey, United Arab Emirates, China, India, Indonesia, Korea, Malaysia, Philippines, Taiwan, and Thailand.
MSCI EAFE Index
The MSCI EAFE Index is a free float-adjusted market capitalization index that is designed to measure the equity market performance of developed markets, excluding the US & Canada. The MSCI EAFE Index consists of the following developed country indices: Australia, Austria, Belgium, Denmark, Finland, France, Germany, Hong Kong, Ireland, Israel, Italy, Japan, the Netherlands, New Zealand, Norway, Portugal, Singapore, Spain, Sweden, Switzerland and the UK.
Bloomberg US Aggregate Bond Index
The Bloomberg U.S. Aggregate Bond Index is an index of the U.S. investment-grade fixed-rate bond market, including both government and corporate bonds.
DXY
The DXY is a U.S. dollar index based on a basket of currencies, including the Euro, Yen, Pound, Canadian Dollar, Swedish Krona and Swiss Franc.
Echo45 Advisors LLC is a Registered Investment Advisor. Registration does not imply any level of skill or training. The information and statistics in this report has been obtained from Clearnomics, a separate and unaffiliated organization. Based on our own due diligence, we believe Clearnomics to be reliable but we do not warrant their accuracy or completeness. This report is for your information only and does not constitute an offer to buy or sell, or the solicitation of any offer to buy or sell any securities. Advisory services are only offered to clients or prospective clients where Echo45 Advisors LLC and its representatives are properly licensed or exempt from licensure. Past performance is no guarantee of future returns. Investing involves risk and possible loss of principal capital. No advice may be rendered by Echo45 Advisors LLC unless a client service agreement is in place.
© 2026 Clearnomics, Inc. All rights reserved. The information contained herein has been obtained from sources believed to be reliable, but is not necessarily complete and its accuracy cannot be guaranteed. No representation or warranty, express or implied, is made as to the fairness, accuracy, completeness, or correctness of the information and opinions contained herein. The views and the other information provided are subject to change without notice. All reports posted on or via www.clearnomics.com or any affiliated websites, applications, or services are issued without regard to the specific investment objectives, financial situation, or particular needs of any specific recipient and are not to be construed as a solicitation or an offer to buy or sell any securities or related financial instruments. Past performance is not necessarily a guide to future results. Company fundamentals and earnings may be mentioned occasionally, but should not be construed as a recommendation to buy, sell, or hold the company’s stock. Predictions, forecasts, and estimates for any and all markets should not be construed as recommendations to buy, sell, or hold any security--including mutual funds, futures contracts, and exchange traded funds, or any similar instruments. The text, images, and other materials contained or displayed in this report are proprietary to Clearnomics, Inc. and constitute valuable intellectual property. All unauthorized reproduction or other use of material from Clearnomics, Inc. shall be deemed willful infringement(s) of this copyright and other proprietary and intellectual property rights, including but not limited to, rights of privacy. Clearnomics, Inc. expressly reserves all rights in connection with its intellectual property, including without limitation the right to block the transfer of its products and services and/or to track usage thereof, through electronic tracking technology, and all other lawful means, now known or hereafter devised. Clearnomics, Inc. reserves the right, without further notice, to pursue to the fullest extent allowed by the law any and all criminal and civil remedies for the violation of its rights.