

July 13, 2026
Echo45 Advisors Investment Committee
The baseball player Yogi Berra once said that “a nickel ain’t worth a dime anymore.” With inflation still elevated, many investors and consumers may be feeling this way as well. Not only are everyday costs higher due to energy prices, but short-term interest rates have fallen over the past two years.
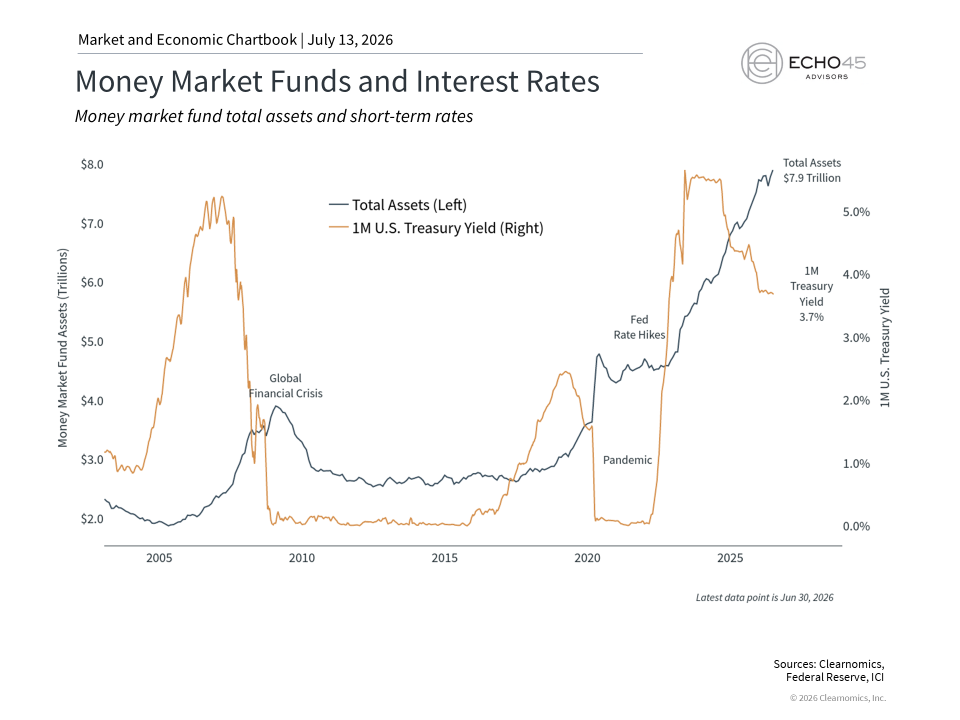
This means that investors who have a significant portion of their portfolios in cash are seeing the purchasing power of their savings decline both as prices rise and as cash yields fall. With money market fund assets near record highs at $7.9 trillion, it’s likely that many investors have cash allocations that exceed what is appropriate for their financial plans.1 What do investors need to understand about the role of cash in their portfolios today?
Managing cash requires careful planning
The role of cash can be a complex topic because it serves many purposes in portfolios, financial plans, and in life. Holding too much cash, however, comes with real long-term costs. These are easy to overlook because cash feels safe, especially compared to the daily swings in the stock market. However, history shows that this can create a drag on wealth accumulation, since the value of cash, unlike stocks, bonds, and other assets, does not compound as much over time.
From an investing and financial planning perspective, the term “cash” is often shorthand for any liquid, short-term holding or vehicle. The most common examples include savings accounts, money market funds, certificates of deposit (CDs), and similar instruments. These serve important purposes, including savings for near-term expenses, building an emergency fund, setting aside money for a home down payment, tuition payments, and more. These are all legitimate and important uses of cash that are a part of any financial plan.
The question is not whether to hold cash, but how much is appropriate given an individual's goals, time horizon, and broader portfolio. Having too much cash is sometimes described as "cash on the sidelines,” since it’s not actively growing, paying dividends, or receiving bond coupons.
As the accompanying chart shows, money market fund assets remain at record levels after climbing alongside interest rates a few years ago. Higher short-term interest rates can appear attractive especially when the stock market seems volatile. However, because they are short-term in nature, these rates are not locked in, creating what investors often refer to as “reinvestment risk.” In order to keep pace with inflation and to achieve financial goals, this cash needs to be put to work in asset classes with the right characteristics.
This is especially important today since short-term rates have already declined. Investors who moved to cash are not only experiencing lower yields, but most likely missed much of the broader market rally of the past few years.
Inflation quietly erodes the value of cash
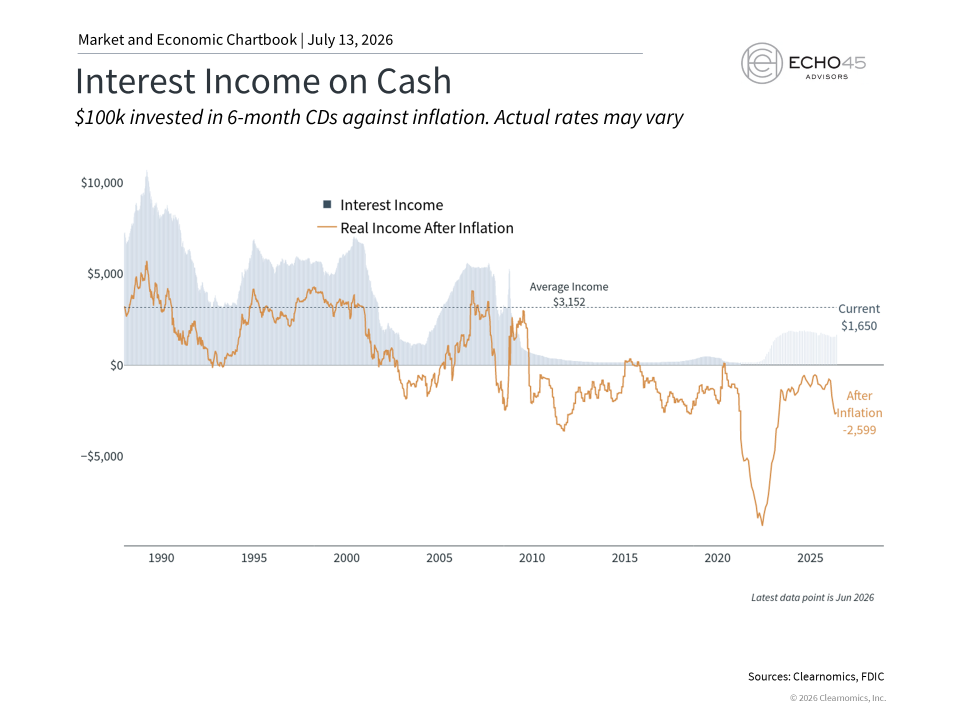
One misconception about cash is that it is truly risk-free. While it may feel this way because the nominal balance on a bank statement doesn’t fluctuate the way the stock market does, its true value can decline all the same. This is because the value of cash is based on what it can purchase, and inflation quietly erodes this over time. This inflationary effect may be small in a given year, but compounds across years and decades unless there are interest payments or asset appreciation to offset it.
As the chart above shows, the inflation-adjusted return on cash, measured using current CD rates according to the FDIC, has been negative for most of the past two decades.2 In other words, even when cash appeared to be generating some income, inflation was running ahead of it. With headline inflation currently at 4.2% and the one-month Treasury yield at 3.7%, real cash yields remain negative today by many measures.3
Money market funds, savings accounts, and short-term CDs must also be rolled over regularly as they mature. This reinvestment risk not only needs to be managed, but is dependent on changing market and economic conditions. Thus, many of the factors that affect stocks and bonds also affect the yields on cash.
Stocks and bonds support long-term growth
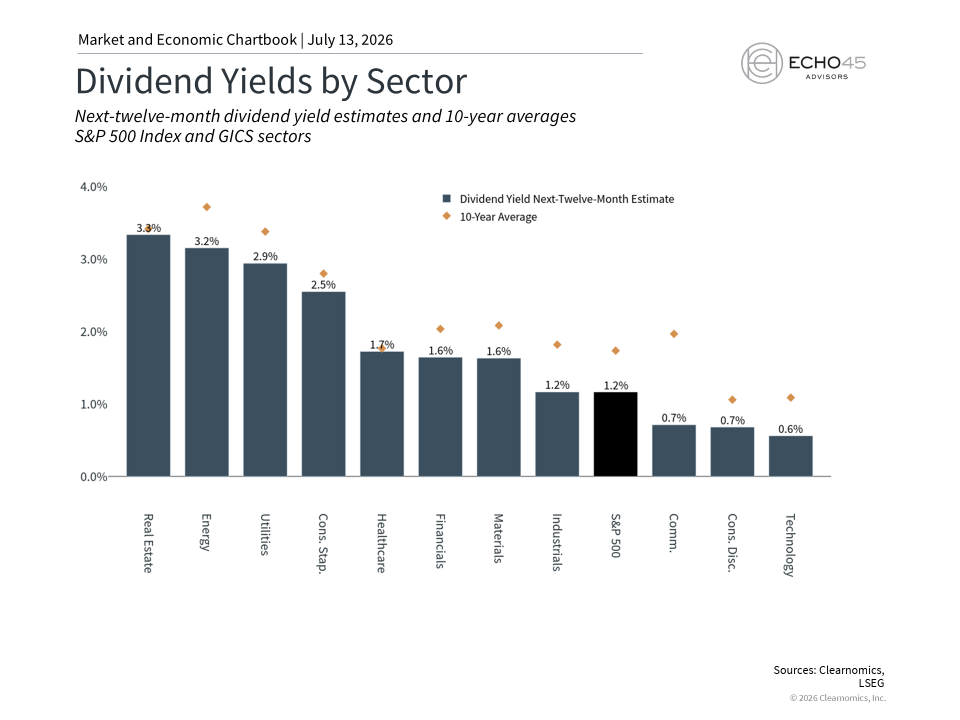
Stocks and bonds are traditionally the foundations of portfolios because they can generate both long-term growth and income. Dividend-paying stocks, for instance, can provide income along with the potential for capital appreciation. While dividends are not guaranteed in the way bond coupons are, sectors of the S&P 500 such as Real Estate, Energy, and Utilities currently offer yields above 3%, comparable to many shorter-term cash and bond instruments.
Extending the maturity on bonds can also result in more attractive interest rates. For instance, the 2-year Treasury yield is currently around 4.2%, which is both a significant increase from short-term cash yields and also matches the latest inflation rates. Investment grade corporate bonds currently yield 5.3% on average, compared to a historical level of 3.9%. The Bloomberg U.S. Aggregate Bond Index yields 4.8%, more than one and a half times its average since 2009. Unlike cash, bonds can gain in value as well, especially in ways that balance the rest of the portfolio.
Ultimately, what history shows is that a portfolio with the right mix of asset classes can not only outpace inflation over time, but can compound to support financial goals. This is not an argument against holding cash, but rather a reminder that the purpose of cash in a portfolio is to serve specific, near-term needs. For investors who have accumulated excess cash over the past few years, it’s important to put it to work thoughtfully.
The bottom line? Cash plays an important role in financial planning, but holding too much comes with long-term trade-offs. Staying invested in a diversified portfolio of stocks and bonds remains the best way to achieve long-term financial goals.
References
1. https://www.ici.org/research/stats/mmf
2. https://www.fdic.gov/national-rates-and-rate-caps
3. https://home.treasury.gov/policy-issues/financing-the-government/interest-rate-statistics
Index Descriptions
S&P 500
The Standard & Poor’s 500 Index is a capitalization-weighted index of 500 stocks designed to measure performance of the broad domestic economy through changes in the aggregate market value of 500 stocks representing all major industries.
Bloomberg US Aggregate Bond Index
The Bloomberg U.S. Aggregate Bond Index is an index of the U.S. investment-grade fixed-rate bond market, including both government and corporate bonds.
Echo45 Advisors LLC is a Registered Investment Advisor. Registration does not imply any level of skill or training. The information and statistics in this report has been obtained from Clearnomics, a separate and unaffiliated organization. Based on our own due diligence, we believe Clearnomics to be reliable but we do not warrant their accuracy or completeness. This report is for your information only and does not constitute an offer to buy or sell, or the solicitation of any offer to buy or sell any securities. Advisory services are only offered to clients or prospective clients where Echo45 Advisors LLC and its representatives are properly licensed or exempt from licensure. Past performance is no guarantee of future returns. Investing involves risk and possible loss of principal capital. No advice may be rendered by Echo45 Advisors LLC unless a client service agreement is in place.
© 2026 Clearnomics, Inc. All rights reserved. The information contained herein has been obtained from sources believed to be reliable, but is not necessarily complete and its accuracy cannot be guaranteed. No representation or warranty, express or implied, is made as to the fairness, accuracy, completeness, or correctness of the information and opinions contained herein. The views and the other information provided are subject to change without notice. All reports posted on or via www.clearnomics.com or any affiliated websites, applications, or services are issued without regard to the specific investment objectives, financial situation, or particular needs of any specific recipient and are not to be construed as a solicitation or an offer to buy or sell any securities or related financial instruments. Past performance is not necessarily a guide to future results. Company fundamentals and earnings may be mentioned occasionally, but should not be construed as a recommendation to buy, sell, or hold the company’s stock. Predictions, forecasts, and estimates for any and all markets should not be construed as recommendations to buy, sell, or hold any security--including mutual funds, futures contracts, and exchange traded funds, or any similar instruments. The text, images, and other materials contained or displayed in this report are proprietary to Clearnomics, Inc. and constitute valuable intellectual property. All unauthorized reproduction or other use of material from Clearnomics, Inc. shall be deemed willful infringement(s) of this copyright and other proprietary and intellectual property rights, including but not limited to, rights of privacy. Clearnomics, Inc. expressly reserves all rights in connection with its intellectual property, including without limitation the right to block the transfer of its products and services and/or to track usage thereof, through electronic tracking technology, and all other lawful means, now known or hereafter devised. Clearnomics, Inc. reserves the right, without further notice, to pursue to the fullest extent allowed by the law any and all criminal and civil remedies for the violation of its rights.